 National Methadone Clinics
Key Numbers
- Listed treatment facilities
- 304closed listings excluded
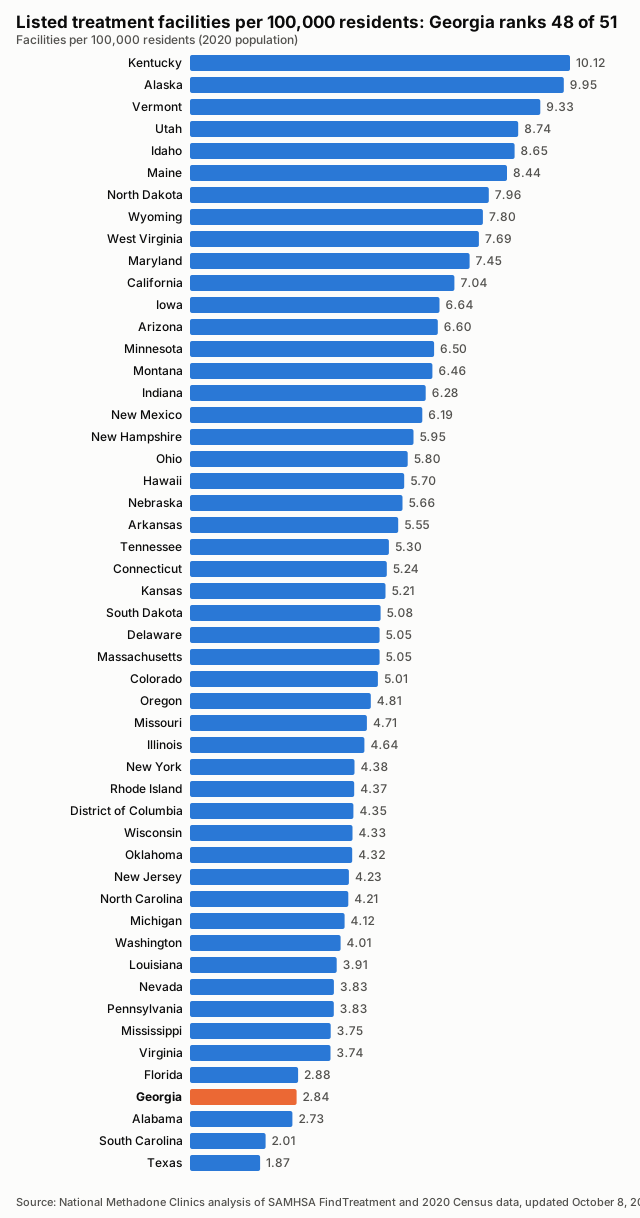
- Facilities per 100,000 residents
- 2.842020 Census population
- Treatment deserts
- 70of 159 counties have no listed facility
- Residents of treatment deserts
- 962,586people in zero-facility counties
- Accept Medicaid
- 69.1%210 of 304 listed facilities
- Population
- 10,711,9082020 Census
Last updated , when the source report was generated.
These figures count listed facilities, not capacity or quality: a listing does not show how many people a facility can treat, how soon, or how well.
How the State Compares
Treatment Deserts
70 counties have no listed treatment facility. Distances are straight-line miles to the nearest listed facility.
| County | Population | Nearest listed facility (miles) |
|---|---|---|
| Bryan County | 44,738 | 8.8 |
| Polk County | 42,853 | 15.7 |
| Oconee County | 41,799 | 7.5 |
| Harris County | 34,668 | 13.8 |
| Sumter County | 29,616 | 20.2 |
| Jones County | 28,347 | 11.9 |
| Monroe County | 27,957 | 13.8 |
| Fannin County | 25,319 | 15.3 |
| Franklin County | 23,424 | 15.1 |
| Putnam County | 22,047 | 16.8 |
| McDuffie County | 21,632 | 20.7 |
| Worth County | 20,784 | 18.8 |
| Crisp County | 20,128 | 30.5 |
| Morgan County | 20,097 | 14.5 |
| Washington County | 19,988 | 26.9 |
| Dodge County | 19,925 | 28.7 |
| Pierce County | 19,716 | 12.7 |
| Pike County | 18,889 | 12.0 |
| Berrien County | 18,160 | 16.3 |
| Banks County | 18,035 | 9.4 |
| Ben Hill County | 17,194 | 23.7 |
| Rabun County | 16,883 | 17.0 |
| Long County | 16,168 | 6.9 |
| Jefferson County | 15,709 | 23.6 |
| Oglethorpe County | 14,825 | 14.8 |
| Jeff Davis County | 14,779 | 17.0 |
| Jasper County | 14,588 | 16.5 |
| Bleckley County | 12,583 | 20.7 |
| Charlton County | 12,518 | 15.2 |
| Towns County | 12,493 | 12.1 |
| Telfair County | 12,477 | 29.0 |
| Crawford County | 12,130 | 12.2 |
| Dooly County | 11,208 | 16.4 |
| McIntosh County | 10,975 | 19.7 |
| Evans County | 10,774 | 13.6 |
| Lanier County | 9,877 | 16.9 |
| Pulaski County | 9,855 | 20.2 |
| Irwin County | 9,666 | 16.0 |
| Chattahoochee County | 9,565 | 12.6 |
| Wilkes County | 9,565 | 24.2 |
| Johnson County | 9,189 | 18.9 |
| Terrell County | 9,185 | 14.6 |
| Seminole County | 9,147 | 17.3 |
| Turner County | 9,006 | 18.5 |
| Wilkinson County | 8,877 | 20.3 |
| Wilcox County | 8,766 | 33.8 |
| Hancock County | 8,735 | 18.4 |
| Jenkins County | 8,674 | 19.9 |
| Montgomery County | 8,610 | 7.8 |
| Atkinson County | 8,286 | 14.0 |
| Twiggs County | 8,022 | 13.1 |
| Taylor County | 7,816 | 21.6 |
| Lincoln County | 7,690 | 12.0 |
| Marion County | 7,498 | 25.3 |
| Wheeler County | 7,471 | 20.4 |
| Randolph County | 6,425 | 24.6 |
| Treutlen County | 6,406 | 16.4 |
| Miller County | 6,000 | 18.1 |
| Talbot County | 5,733 | 18.0 |
| Calhoun County | 5,573 | 20.7 |
| Stewart County | 5,314 | 21.8 |
| Warren County | 5,215 | 31.5 |
| Schley County | 4,547 | 17.2 |
| Echols County | 3,697 | 13.7 |
| Glascock County | 2,884 | 31.1 |
| Baker County | 2,876 | 22.3 |
| Clay County | 2,848 | 16.0 |
| Webster County | 2,348 | 33.5 |
| Quitman County | 2,235 | 8.3 |
| Taliaferro County | 1,559 | 18.8 |
Desert Counties by Population

Find Care Near Treatment Deserts
All Counties, Ranked
| Rank | County | Population | Listed facilities | Per 100,000 | Status |
|---|---|---|---|---|---|
| 1 | Clinch County | 6,749 | 1 | 14.82 | |
| 2 | Toombs County | 27,030 | 4 | 14.80 | |
| 3 | Ware County | 36,251 | 5 | 13.79 | |
| 4 | Emanuel County | 22,768 | 3 | 13.18 | |
| 5 | Dade County | 16,251 | 2 | 12.31 | |
| 6 | Union County | 24,632 | 3 | 12.18 | |
| 7 | Lamar County | 18,500 | 2 | 10.81 | |
| 8 | Greene County | 18,915 | 2 | 10.57 | |
| 9 | Bulloch County | 81,099 | 8 | 9.86 | |
| 10 | Early County | 10,854 | 1 | 9.21 | |
| 11 | Candler County | 10,981 | 1 | 9.11 | |
| 12 | Bacon County | 11,140 | 1 | 8.98 | |
| 13 | Heard County | 11,412 | 1 | 8.76 | |
| 14 | Macon County | 12,082 | 1 | 8.28 | |
| 15 | Liberty County | 65,256 | 5 | 7.66 | |
| 16 | Stephens County | 26,784 | 2 | 7.47 | |
| 17 | White County | 28,003 | 2 | 7.14 | |
| 18 | Screven County | 14,067 | 1 | 7.11 | |
| 19 | Decatur County | 29,367 | 2 | 6.81 | |
| 20 | Thomas County | 45,798 | 3 | 6.55 | |
| 21 | Brooks County | 16,301 | 1 | 6.13 | |
| 22 | Laurens County | 49,570 | 3 | 6.05 | |
| 23 | Spalding County | 67,306 | 4 | 5.94 | |
| 24 | Lowndes County | 118,251 | 7 | 5.92 | |
| 25 | Catoosa County | 67,872 | 4 | 5.89 | |
| 26 | Cook County | 17,229 | 1 | 5.80 | |
| 27 | Brantley County | 18,021 | 1 | 5.55 | |
| 28 | Camden County | 54,768 | 3 | 5.48 | |
| 29 | Clarke County | 128,671 | 7 | 5.44 | |
| 30 | Appling County | 18,444 | 1 | 5.42 | |
| 31 | Rockdale County | 93,570 | 5 | 5.34 | |
| 32 | Elbert County | 19,637 | 1 | 5.09 | |
| 33 | Meriwether County | 20,613 | 1 | 4.85 | |
| 34 | Tift County | 41,344 | 2 | 4.84 | |
| 35 | Glynn County | 84,499 | 4 | 4.73 | |
| 36 | Mitchell County | 21,755 | 1 | 4.60 | |
| 37 | Baldwin County | 43,799 | 2 | 4.57 | |
| 38 | Tattnall County | 22,842 | 1 | 4.38 | |
| 39 | Colquitt County | 45,898 | 2 | 4.36 | |
| 40 | Burke County | 24,596 | 1 | 4.07 | |
| 41 | Chatham County | 295,291 | 12 | 4.06 | |
| 42 | Chattooga County | 24,965 | 1 | 4.01 | |
| 43 | Jackson County | 75,907 | 3 | 3.95 | |
| 44 | Butts County | 25,434 | 1 | 3.93 | |
| 45 | Hart County | 25,828 | 1 | 3.87 | |
| 46 | Grady County | 26,236 | 1 | 3.81 | |
| 47 | Dawson County | 26,798 | 1 | 3.73 | |
| 48 | Upson County | 27,700 | 1 | 3.61 | |
| 49 | Barrow County | 83,505 | 3 | 3.59 | |
| 50 | Peach County | 27,981 | 1 | 3.57 | |
| 51 | Dougherty County | 85,790 | 3 | 3.50 | |
| 52 | Hall County | 203,136 | 7 | 3.45 | |
| 53 | Richmond County | 206,607 | 7 | 3.39 | |
| 54 | Carroll County | 119,148 | 4 | 3.36 | |
| 55 | Fayette County | 119,194 | 4 | 3.36 | |
| 56 | Haralson County | 29,919 | 1 | 3.34 | |
| 57 | Madison County | 30,120 | 1 | 3.32 | |
| 58 | Wayne County | 30,144 | 1 | 3.32 | |
| 59 | Gilmer County | 31,353 | 1 | 3.19 | |
| 60 | Bibb County | 157,346 | 5 | 3.18 | |
| 61 | Floyd County | 98,584 | 3 | 3.04 | |
| 62 | Lee County | 33,163 | 1 | 3.02 | |
| 63 | Pickens County | 33,216 | 1 | 3.01 | |
| 64 | DeKalb County | 764,382 | 23 | 3.01 | |
| 65 | Lumpkin County | 33,488 | 1 | 2.99 | |
| 66 | Paulding County | 168,661 | 5 | 2.96 | |
| 67 | Walker County | 67,654 | 2 | 2.96 | |
| 68 | Fulton County | 1,066,710 | 31 | 2.91 | |
| 69 | Muscogee County | 206,922 | 6 | 2.90 | |
| 70 | Troup County | 69,426 | 2 | 2.88 | |
| 71 | Coweta County | 146,158 | 4 | 2.74 | |
| 72 | Murray County | 39,973 | 1 | 2.50 | |
| 73 | Coffee County | 43,092 | 1 | 2.32 | |
| 74 | Habersham County | 46,031 | 1 | 2.17 | |
| 75 | Walton County | 96,673 | 2 | 2.07 | |
| 76 | Clayton County | 297,595 | 6 | 2.02 | |
| 77 | Forsyth County | 251,283 | 5 | 1.99 | |
| 78 | Houston County | 163,633 | 3 | 1.83 | |
| 79 | Newton County | 112,483 | 2 | 1.78 | |
| 80 | Gordon County | 57,544 | 1 | 1.74 | |
| 81 | Cobb County | 766,149 | 13 | 1.70 | |
| 82 | Henry County | 240,712 | 4 | 1.66 | |
| 83 | Effingham County | 64,769 | 1 | 1.54 | |
| 84 | Cherokee County | 266,620 | 4 | 1.50 | |
| 85 | Gwinnett County | 957,062 | 14 | 1.46 | |
| 86 | Douglas County | 144,237 | 2 | 1.39 | |
| 87 | Columbia County | 156,010 | 2 | 1.28 | |
| 88 | Whitfield County | 102,864 | 1 | 0.97 | |
| 89 | Bartow County | 108,901 | 1 | 0.92 | |
| 90 | Atkinson County | 8,286 | 0 | 0.00 | Treatment desert |
| 91 | Baker County | 2,876 | 0 | 0.00 | Treatment desert |
| 92 | Banks County | 18,035 | 0 | 0.00 | Treatment desert |
| 93 | Ben Hill County | 17,194 | 0 | 0.00 | Treatment desert |
| 94 | Berrien County | 18,160 | 0 | 0.00 | Treatment desert |
| 95 | Bleckley County | 12,583 | 0 | 0.00 | Treatment desert |
| 96 | Bryan County | 44,738 | 0 | 0.00 | Treatment desert |
| 97 | Calhoun County | 5,573 | 0 | 0.00 | Treatment desert |
| 98 | Charlton County | 12,518 | 0 | 0.00 | Treatment desert |
| 99 | Chattahoochee County | 9,565 | 0 | 0.00 | Treatment desert |
| 100 | Clay County | 2,848 | 0 | 0.00 | Treatment desert |
| 101 | Crawford County | 12,130 | 0 | 0.00 | Treatment desert |
| 102 | Crisp County | 20,128 | 0 | 0.00 | Treatment desert |
| 103 | Dodge County | 19,925 | 0 | 0.00 | Treatment desert |
| 104 | Dooly County | 11,208 | 0 | 0.00 | Treatment desert |
| 105 | Echols County | 3,697 | 0 | 0.00 | Treatment desert |
| 106 | Evans County | 10,774 | 0 | 0.00 | Treatment desert |
| 107 | Fannin County | 25,319 | 0 | 0.00 | Treatment desert |
| 108 | Franklin County | 23,424 | 0 | 0.00 | Treatment desert |
| 109 | Glascock County | 2,884 | 0 | 0.00 | Treatment desert |
| 110 | Hancock County | 8,735 | 0 | 0.00 | Treatment desert |
| 111 | Harris County | 34,668 | 0 | 0.00 | Treatment desert |
| 112 | Irwin County | 9,666 | 0 | 0.00 | Treatment desert |
| 113 | Jasper County | 14,588 | 0 | 0.00 | Treatment desert |
| 114 | Jeff Davis County | 14,779 | 0 | 0.00 | Treatment desert |
| 115 | Jefferson County | 15,709 | 0 | 0.00 | Treatment desert |
| 116 | Jenkins County | 8,674 | 0 | 0.00 | Treatment desert |
| 117 | Johnson County | 9,189 | 0 | 0.00 | Treatment desert |
| 118 | Jones County | 28,347 | 0 | 0.00 | Treatment desert |
| 119 | Lanier County | 9,877 | 0 | 0.00 | Treatment desert |
| 120 | Lincoln County | 7,690 | 0 | 0.00 | Treatment desert |
| 121 | Long County | 16,168 | 0 | 0.00 | Treatment desert |
| 122 | Marion County | 7,498 | 0 | 0.00 | Treatment desert |
| 123 | McDuffie County | 21,632 | 0 | 0.00 | Treatment desert |
| 124 | McIntosh County | 10,975 | 0 | 0.00 | Treatment desert |
| 125 | Miller County | 6,000 | 0 | 0.00 | Treatment desert |
| 126 | Monroe County | 27,957 | 0 | 0.00 | Treatment desert |
| 127 | Montgomery County | 8,610 | 0 | 0.00 | Treatment desert |
| 128 | Morgan County | 20,097 | 0 | 0.00 | Treatment desert |
| 129 | Oconee County | 41,799 | 0 | 0.00 | Treatment desert |
| 130 | Oglethorpe County | 14,825 | 0 | 0.00 | Treatment desert |
| 131 | Pierce County | 19,716 | 0 | 0.00 | Treatment desert |
| 132 | Pike County | 18,889 | 0 | 0.00 | Treatment desert |
| 133 | Polk County | 42,853 | 0 | 0.00 | Treatment desert |
| 134 | Pulaski County | 9,855 | 0 | 0.00 | Treatment desert |
| 135 | Putnam County | 22,047 | 0 | 0.00 | Treatment desert |
| 136 | Quitman County | 2,235 | 0 | 0.00 | Treatment desert |
| 137 | Rabun County | 16,883 | 0 | 0.00 | Treatment desert |
| 138 | Randolph County | 6,425 | 0 | 0.00 | Treatment desert |
| 139 | Schley County | 4,547 | 0 | 0.00 | Treatment desert |
| 140 | Seminole County | 9,147 | 0 | 0.00 | Treatment desert |
| 141 | Stewart County | 5,314 | 0 | 0.00 | Treatment desert |
| 142 | Sumter County | 29,616 | 0 | 0.00 | Treatment desert |
| 143 | Talbot County | 5,733 | 0 | 0.00 | Treatment desert |
| 144 | Taliaferro County | 1,559 | 0 | 0.00 | Treatment desert |
| 145 | Taylor County | 7,816 | 0 | 0.00 | Treatment desert |
| 146 | Telfair County | 12,477 | 0 | 0.00 | Treatment desert |
| 147 | Terrell County | 9,185 | 0 | 0.00 | Treatment desert |
| 148 | Towns County | 12,493 | 0 | 0.00 | Treatment desert |
| 149 | Treutlen County | 6,406 | 0 | 0.00 | Treatment desert |
| 150 | Turner County | 9,006 | 0 | 0.00 | Treatment desert |
| 151 | Twiggs County | 8,022 | 0 | 0.00 | Treatment desert |
| 152 | Warren County | 5,215 | 0 | 0.00 | Treatment desert |
| 153 | Washington County | 19,988 | 0 | 0.00 | Treatment desert |
| 154 | Webster County | 2,348 | 0 | 0.00 | Treatment desert |
| 155 | Wheeler County | 7,471 | 0 | 0.00 | Treatment desert |
| 156 | Wilcox County | 8,766 | 0 | 0.00 | Treatment desert |
| 157 | Wilkes County | 9,565 | 0 | 0.00 | Treatment desert |
| 158 | Wilkinson County | 8,877 | 0 | 0.00 | Treatment desert |
| 159 | Worth County | 20,784 | 0 | 0.00 | Treatment desert |
Methodology
Every number on this page is calculated directly from public records; no figure is estimated or written by hand.
Facilities are the treatment locations listed in SAMHSA's FindTreatment.gov locator, each counted once by its listing ID. Closed listings are excluded; active and unconfirmed listings are included (unique IDs; closed excluded; active and unconfirmed included).
Density divides the number of listed facilities by the 2020 Census resident population and multiplies by 100,000.
A treatment desert is a county with zero listed facilities. Facilities are placed in counties by their coordinates against Census county boundaries; deserts are only reported when every listed facility in the state has a verified county.
The Medicaid share is the number of listed facilities that report accepting Medicaid divided by all listed facilities; facilities that do not report it count as not confirmed.
Distances are straight-line (great-circle) miles from a county's Census reference point to the nearest geocoded listed facility in any state. They are not driving distances.
These are listed facilities, not capacity or quality: counts describe listings, not beds, wait times, outcomes or proof of access to care.
Known Gaps in This Data
- None reported for this state.
Sources and Reuse
- SAMHSA FindTreatment.gov treatment locator (Substance Abuse and Mental Health Services Administration): Listed treatment facilities, operating status and Medicaid acceptance.
- 2020 Census redistricting data (P.L. 94-171), table P1 (U.S. Census Bureau): State and county resident population (2020).
- 2020 cartographic boundary files, counties (1:500,000) (U.S. Census Bureau): County boundaries for assigning facilities to counties and for the county map.
- 2020 Census Gazetteer files, counties (U.S. Census Bureau): County reference points for nearest-facility distances.
Download this data: County table (CSV) · Full data (JSON)
Licence: this data and its charts are published under the Creative Commons Attribution 4.0 (CC BY 4.0) licence. You may copy, share and adapt them, including commercially. Attribution: credit National Methadone Clinics and link to the source page, https://nationalmethadoneclinics.com/data/georgia/.