 National Methadone Clinics
Key Numbers
- Listed treatment facilities
- 415closed listings excluded
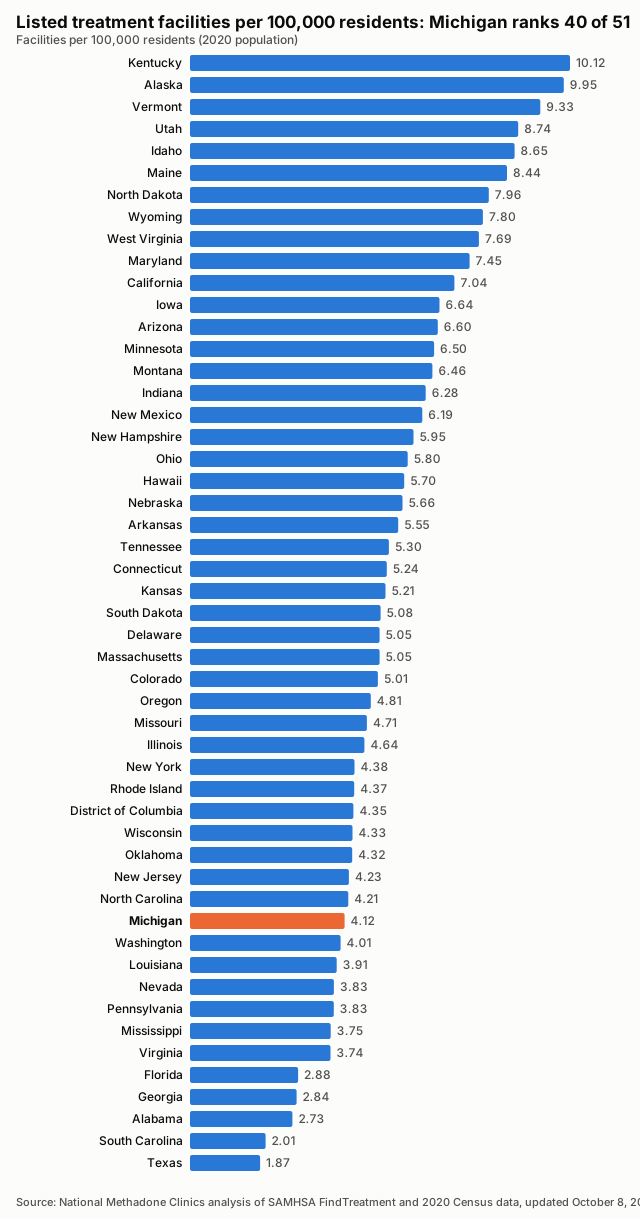
- Facilities per 100,000 residents
- 4.122020 Census population
- Treatment deserts
- 13of 83 counties have no listed facility
- Residents of treatment deserts
- 310,408people in zero-facility counties
- Accept Medicaid
- 88.4%367 of 415 listed facilities
- Population
- 10,077,3312020 Census
Last updated , when the source report was generated.
These figures count listed facilities, not capacity or quality: a listing does not show how many people a facility can treat, how soon, or how well.
How the State Compares
Treatment Deserts
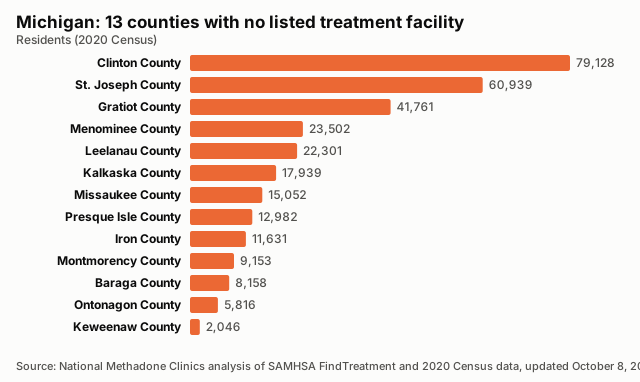
13 counties have no listed treatment facility. Distances are straight-line miles to the nearest listed facility.
| County | Population | Nearest listed facility (miles) |
|---|---|---|
| Clinton County | 79,128 | 13.9 |
| St. Joseph County | 60,939 | 17.2 |
| Gratiot County | 41,761 | 22.8 |
| Menominee County | 23,502 | 24.5 |
| Leelanau County | 22,301 | 33.5 |
| Kalkaska County | 17,939 | 15.3 |
| Missaukee County | 15,052 | 14.2 |
| Presque Isle County | 12,982 | 12.4 |
| Iron County | 11,631 | 33.1 |
| Montmorency County | 9,153 | 25.7 |
| Baraga County | 8,158 | 36.2 |
| Ontonagon County | 5,816 | 48.3 |
| Keweenaw County | 2,046 | 9.3 |
Desert Counties by Population
All Counties, Ranked
| Rank | County | Population | Listed facilities | Per 100,000 | Status |
|---|---|---|---|---|---|
| 1 | Mackinac County | 10,834 | 4 | 36.92 | |
| 2 | Alger County | 8,842 | 3 | 33.93 | |
| 3 | Schoolcraft County | 8,047 | 2 | 24.85 | |
| 4 | Crawford County | 12,988 | 3 | 23.10 | |
| 5 | Arenac County | 15,002 | 3 | 20.00 | |
| 6 | Otsego County | 25,091 | 5 | 19.93 | |
| 7 | Luce County | 5,339 | 1 | 18.73 | |
| 8 | Manistee County | 25,032 | 4 | 15.98 | |
| 9 | Alpena County | 28,907 | 4 | 13.84 | |
| 10 | Chippewa County | 36,785 | 5 | 13.59 | |
| 11 | Roscommon County | 23,459 | 3 | 12.79 | |
| 12 | Oscoda County | 8,219 | 1 | 12.17 | |
| 13 | Gladwin County | 25,386 | 3 | 11.82 | |
| 14 | Cheboygan County | 25,579 | 3 | 11.73 | |
| 15 | Emmet County | 34,112 | 4 | 11.73 | |
| 16 | Marquette County | 66,017 | 7 | 10.60 | |
| 17 | Alcona County | 10,167 | 1 | 9.84 | |
| 18 | Clare County | 30,856 | 3 | 9.72 | |
| 19 | Huron County | 31,407 | 3 | 9.55 | |
| 20 | Wexford County | 33,673 | 3 | 8.91 | |
| 21 | Midland County | 83,494 | 7 | 8.38 | |
| 22 | Lake County | 12,096 | 1 | 8.27 | |
| 23 | Delta County | 36,903 | 3 | 8.13 | |
| 24 | Iosco County | 25,237 | 2 | 7.92 | |
| 25 | Isabella County | 64,394 | 5 | 7.76 | |
| 26 | Mecosta County | 39,714 | 3 | 7.55 | |
| 27 | Gogebic County | 14,380 | 1 | 6.95 | |
| 28 | Mason County | 29,052 | 2 | 6.88 | |
| 29 | Saginaw County | 190,124 | 12 | 6.31 | |
| 30 | Grand Traverse County | 95,238 | 6 | 6.30 | |
| 31 | Ionia County | 66,804 | 4 | 5.99 | |
| 32 | Muskegon County | 175,824 | 10 | 5.69 | |
| 33 | Tuscola County | 53,323 | 3 | 5.63 | |
| 34 | Benzie County | 17,970 | 1 | 5.56 | |
| 35 | Ingham County | 284,900 | 15 | 5.27 | |
| 36 | Sanilac County | 40,611 | 2 | 4.92 | |
| 37 | Ogemaw County | 20,770 | 1 | 4.81 | |
| 38 | Berrien County | 154,316 | 7 | 4.54 | |
| 39 | Lapeer County | 88,619 | 4 | 4.51 | |
| 40 | Calhoun County | 134,310 | 6 | 4.47 | |
| 41 | Hillsdale County | 45,746 | 2 | 4.37 | |
| 42 | Osceola County | 22,891 | 1 | 4.37 | |
| 43 | St. Clair County | 160,383 | 7 | 4.36 | |
| 44 | Antrim County | 23,431 | 1 | 4.27 | |
| 45 | Kalamazoo County | 261,670 | 11 | 4.20 | |
| 46 | Livingston County | 193,866 | 8 | 4.13 | |
| 47 | Wayne County | 1,793,561 | 71 | 3.96 | |
| 48 | Genesee County | 406,211 | 16 | 3.94 | |
| 49 | Cass County | 51,589 | 2 | 3.88 | |
| 50 | Dickinson County | 25,947 | 1 | 3.85 | |
| 51 | Charlevoix County | 26,054 | 1 | 3.84 | |
| 52 | Oceana County | 26,659 | 1 | 3.75 | |
| 53 | Ottawa County | 296,200 | 11 | 3.71 | |
| 54 | Allegan County | 120,502 | 4 | 3.32 | |
| 55 | Oakland County | 1,274,395 | 42 | 3.30 | |
| 56 | Monroe County | 154,809 | 5 | 3.23 | |
| 57 | Kent County | 657,974 | 21 | 3.19 | |
| 58 | Jackson County | 160,366 | 5 | 3.12 | |
| 59 | Shiawassee County | 68,094 | 2 | 2.94 | |
| 60 | Bay County | 103,856 | 3 | 2.89 | |
| 61 | Eaton County | 109,175 | 3 | 2.75 | |
| 62 | Washtenaw County | 372,258 | 10 | 2.69 | |
| 63 | Houghton County | 37,361 | 1 | 2.68 | |
| 64 | Van Buren County | 75,587 | 2 | 2.65 | |
| 65 | Branch County | 44,862 | 1 | 2.23 | |
| 66 | Macomb County | 881,217 | 18 | 2.04 | |
| 67 | Lenawee County | 99,423 | 2 | 2.01 | |
| 68 | Newaygo County | 49,978 | 1 | 2.00 | |
| 69 | Barry County | 62,423 | 1 | 1.60 | |
| 70 | Montcalm County | 66,614 | 1 | 1.50 | |
| 71 | Baraga County | 8,158 | 0 | 0.00 | Treatment desert |
| 72 | Clinton County | 79,128 | 0 | 0.00 | Treatment desert |
| 73 | Gratiot County | 41,761 | 0 | 0.00 | Treatment desert |
| 74 | Iron County | 11,631 | 0 | 0.00 | Treatment desert |
| 75 | Kalkaska County | 17,939 | 0 | 0.00 | Treatment desert |
| 76 | Keweenaw County | 2,046 | 0 | 0.00 | Treatment desert |
| 77 | Leelanau County | 22,301 | 0 | 0.00 | Treatment desert |
| 78 | Menominee County | 23,502 | 0 | 0.00 | Treatment desert |
| 79 | Missaukee County | 15,052 | 0 | 0.00 | Treatment desert |
| 80 | Montmorency County | 9,153 | 0 | 0.00 | Treatment desert |
| 81 | Ontonagon County | 5,816 | 0 | 0.00 | Treatment desert |
| 82 | Presque Isle County | 12,982 | 0 | 0.00 | Treatment desert |
| 83 | St. Joseph County | 60,939 | 0 | 0.00 | Treatment desert |
Methodology
Every number on this page is calculated directly from public records; no figure is estimated or written by hand.
Facilities are the treatment locations listed in SAMHSA's FindTreatment.gov locator, each counted once by its listing ID. Closed listings are excluded; active and unconfirmed listings are included (unique IDs; closed excluded; active and unconfirmed included).
Density divides the number of listed facilities by the 2020 Census resident population and multiplies by 100,000.
A treatment desert is a county with zero listed facilities. Facilities are placed in counties by their coordinates against Census county boundaries; deserts are only reported when every listed facility in the state has a verified county.
The Medicaid share is the number of listed facilities that report accepting Medicaid divided by all listed facilities; facilities that do not report it count as not confirmed.
Distances are straight-line (great-circle) miles from a county's Census reference point to the nearest geocoded listed facility in any state. They are not driving distances.
These are listed facilities, not capacity or quality: counts describe listings, not beds, wait times, outcomes or proof of access to care.
Known Gaps in This Data
- None reported for this state.
Sources and Reuse
- SAMHSA FindTreatment.gov treatment locator (Substance Abuse and Mental Health Services Administration): Listed treatment facilities, operating status and Medicaid acceptance.
- 2020 Census redistricting data (P.L. 94-171), table P1 (U.S. Census Bureau): State and county resident population (2020).
- 2020 cartographic boundary files, counties (1:500,000) (U.S. Census Bureau): County boundaries for assigning facilities to counties and for the county map.
- 2020 Census Gazetteer files, counties (U.S. Census Bureau): County reference points for nearest-facility distances.
Download this data: County table (CSV) · Full data (JSON)
Licence: this data and its charts are published under the Creative Commons Attribution 4.0 (CC BY 4.0) licence. You may copy, share and adapt them, including commercially. Attribution: credit National Methadone Clinics and link to the source page, https://nationalmethadoneclinics.com/data/michigan/.