 National Methadone Clinics
Key Numbers
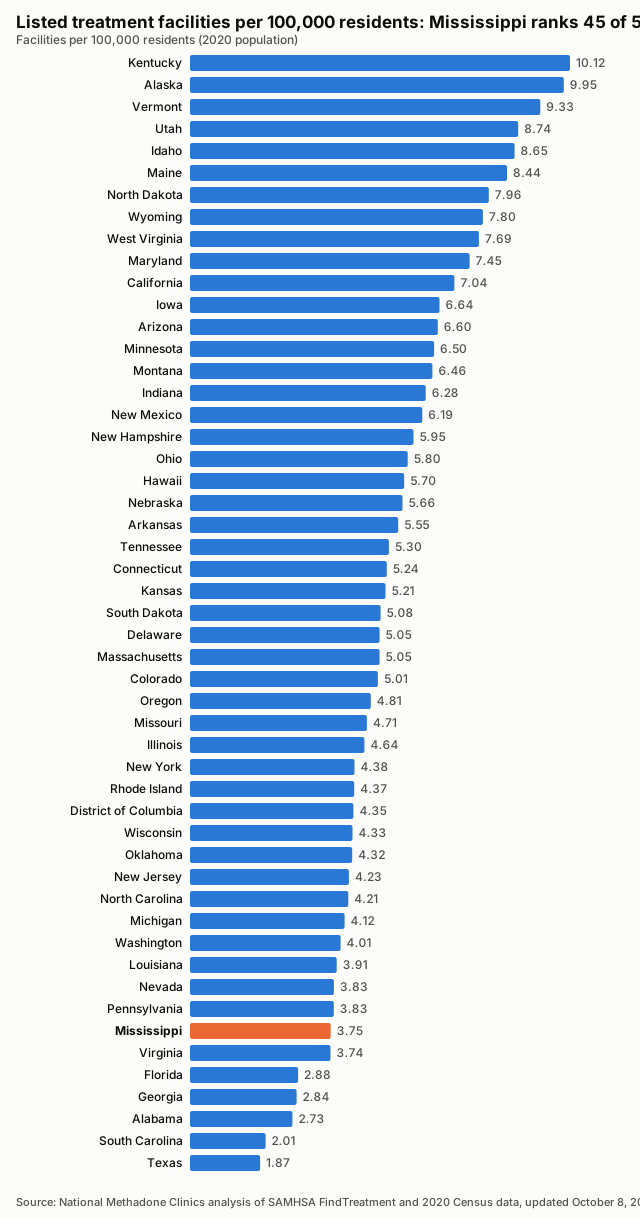
- Listed treatment facilities
- 111closed listings excluded
- Facilities per 100,000 residents
- 3.752020 Census population
- Treatment deserts
- 24of 82 counties have no listed facility
- Residents of treatment deserts
- 432,086people in zero-facility counties
- Accept Medicaid
- 82.9%92 of 111 listed facilities
- Population
- 2,961,2792020 Census
Last updated , when the source report was generated.
These figures count listed facilities, not capacity or quality: a listing does not show how many people a facility can treat, how soon, or how well.
How the State Compares
Treatment Deserts
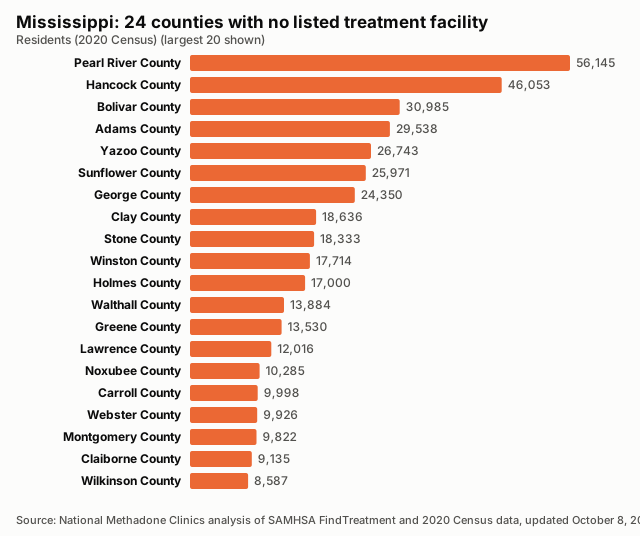
24 counties have no listed treatment facility. Distances are straight-line miles to the nearest listed facility.
| County | Population | Nearest listed facility (miles) |
|---|---|---|
| Pearl River County | 56,145 | 15.6 |
| Hancock County | 46,053 | 17.5 |
| Bolivar County | 30,985 | 28.2 |
| Adams County | 29,538 | 22.5 |
| Yazoo County | 26,743 | 21.9 |
| Sunflower County | 25,971 | 26.3 |
| George County | 24,350 | 29.7 |
| Clay County | 18,636 | 13.3 |
| Stone County | 18,333 | 24.6 |
| Winston County | 17,714 | 22.7 |
| Holmes County | 17,000 | 23.2 |
| Walthall County | 13,884 | 17.0 |
| Greene County | 13,530 | 21.2 |
| Lawrence County | 12,016 | 15.0 |
| Noxubee County | 10,285 | 24.0 |
| Carroll County | 9,998 | 14.4 |
| Webster County | 9,926 | 22.3 |
| Montgomery County | 9,822 | 21.7 |
| Claiborne County | 9,135 | 20.6 |
| Wilkinson County | 8,587 | 30.7 |
| Choctaw County | 8,246 | 26.6 |
| Franklin County | 7,675 | 18.7 |
| Quitman County | 6,176 | 15.5 |
| Issaquena County | 1,338 | 12.5 |
Desert Counties by Population
All Counties, Ranked
| Rank | County | Population | Listed facilities | Per 100,000 | Status |
|---|---|---|---|---|---|
| 1 | Sharkey County | 3,800 | 1 | 26.32 | |
| 2 | Jefferson County | 7,260 | 1 | 13.77 | |
| 3 | Benton County | 7,646 | 1 | 13.08 | |
| 4 | Humphreys County | 7,785 | 1 | 12.85 | |
| 5 | Kemper County | 8,988 | 1 | 11.13 | |
| 6 | Tunica County | 9,782 | 1 | 10.22 | |
| 7 | Lafayette County | 55,813 | 5 | 8.96 | |
| 8 | Jefferson Davis County | 11,321 | 1 | 8.83 | |
| 9 | Perry County | 11,511 | 1 | 8.69 | |
| 10 | Lee County | 83,343 | 7 | 8.40 | |
| 11 | Yalobusha County | 12,481 | 1 | 8.01 | |
| 12 | Tallahatchie County | 12,715 | 1 | 7.86 | |
| 13 | Amite County | 12,720 | 1 | 7.86 | |
| 14 | Simpson County | 25,949 | 2 | 7.71 | |
| 15 | Calhoun County | 13,266 | 1 | 7.54 | |
| 16 | Pike County | 40,324 | 3 | 7.44 | |
| 17 | Tate County | 28,064 | 2 | 7.13 | |
| 18 | Leflore County | 28,339 | 2 | 7.06 | |
| 19 | Copiah County | 28,368 | 2 | 7.05 | |
| 20 | Smith County | 14,209 | 1 | 7.04 | |
| 21 | Lowndes County | 58,879 | 4 | 6.79 | |
| 22 | Pontotoc County | 31,184 | 2 | 6.41 | |
| 23 | Clarke County | 15,615 | 1 | 6.40 | |
| 24 | Jasper County | 16,367 | 1 | 6.11 | |
| 25 | Marshall County | 33,752 | 2 | 5.93 | |
| 26 | Chickasaw County | 17,106 | 1 | 5.85 | |
| 27 | Alcorn County | 34,740 | 2 | 5.76 | |
| 28 | Attala County | 17,889 | 1 | 5.59 | |
| 29 | Lauderdale County | 72,984 | 4 | 5.48 | |
| 30 | Covington County | 18,340 | 1 | 5.45 | |
| 31 | Tishomingo County | 18,850 | 1 | 5.31 | |
| 32 | Rankin County | 157,031 | 8 | 5.09 | |
| 33 | Wayne County | 19,779 | 1 | 5.06 | |
| 34 | Leake County | 21,275 | 1 | 4.70 | |
| 35 | Newton County | 21,291 | 1 | 4.70 | |
| 36 | Coahoma County | 21,390 | 1 | 4.68 | |
| 37 | Grenada County | 21,629 | 1 | 4.62 | |
| 38 | Tippah County | 21,815 | 1 | 4.58 | |
| 39 | Itawamba County | 23,863 | 1 | 4.19 | |
| 40 | Marion County | 24,441 | 1 | 4.09 | |
| 41 | Prentiss County | 25,008 | 1 | 4.00 | |
| 42 | Hinds County | 227,742 | 9 | 3.95 | |
| 43 | Forrest County | 78,158 | 3 | 3.84 | |
| 44 | Union County | 27,777 | 1 | 3.60 | |
| 45 | Scott County | 27,990 | 1 | 3.57 | |
| 46 | Neshoba County | 29,087 | 1 | 3.44 | |
| 47 | Lamar County | 64,222 | 2 | 3.11 | |
| 48 | Panola County | 33,208 | 1 | 3.01 | |
| 49 | Jones County | 67,246 | 2 | 2.97 | |
| 50 | Monroe County | 34,180 | 1 | 2.93 | |
| 51 | Lincoln County | 34,907 | 1 | 2.86 | |
| 52 | Madison County | 109,145 | 3 | 2.75 | |
| 53 | Harrison County | 208,621 | 5 | 2.40 | |
| 54 | Warren County | 44,722 | 1 | 2.24 | |
| 55 | Washington County | 44,922 | 1 | 2.23 | |
| 56 | DeSoto County | 185,314 | 4 | 2.16 | |
| 57 | Oktibbeha County | 51,788 | 1 | 1.93 | |
| 58 | Jackson County | 143,252 | 1 | 0.70 | |
| 59 | Adams County | 29,538 | 0 | 0.00 | Treatment desert |
| 60 | Bolivar County | 30,985 | 0 | 0.00 | Treatment desert |
| 61 | Carroll County | 9,998 | 0 | 0.00 | Treatment desert |
| 62 | Choctaw County | 8,246 | 0 | 0.00 | Treatment desert |
| 63 | Claiborne County | 9,135 | 0 | 0.00 | Treatment desert |
| 64 | Clay County | 18,636 | 0 | 0.00 | Treatment desert |
| 65 | Franklin County | 7,675 | 0 | 0.00 | Treatment desert |
| 66 | George County | 24,350 | 0 | 0.00 | Treatment desert |
| 67 | Greene County | 13,530 | 0 | 0.00 | Treatment desert |
| 68 | Hancock County | 46,053 | 0 | 0.00 | Treatment desert |
| 69 | Holmes County | 17,000 | 0 | 0.00 | Treatment desert |
| 70 | Issaquena County | 1,338 | 0 | 0.00 | Treatment desert |
| 71 | Lawrence County | 12,016 | 0 | 0.00 | Treatment desert |
| 72 | Montgomery County | 9,822 | 0 | 0.00 | Treatment desert |
| 73 | Noxubee County | 10,285 | 0 | 0.00 | Treatment desert |
| 74 | Pearl River County | 56,145 | 0 | 0.00 | Treatment desert |
| 75 | Quitman County | 6,176 | 0 | 0.00 | Treatment desert |
| 76 | Stone County | 18,333 | 0 | 0.00 | Treatment desert |
| 77 | Sunflower County | 25,971 | 0 | 0.00 | Treatment desert |
| 78 | Walthall County | 13,884 | 0 | 0.00 | Treatment desert |
| 79 | Webster County | 9,926 | 0 | 0.00 | Treatment desert |
| 80 | Wilkinson County | 8,587 | 0 | 0.00 | Treatment desert |
| 81 | Winston County | 17,714 | 0 | 0.00 | Treatment desert |
| 82 | Yazoo County | 26,743 | 0 | 0.00 | Treatment desert |
Methodology
Every number on this page is calculated directly from public records; no figure is estimated or written by hand.
Facilities are the treatment locations listed in SAMHSA's FindTreatment.gov locator, each counted once by its listing ID. Closed listings are excluded; active and unconfirmed listings are included (unique IDs; closed excluded; active and unconfirmed included).
Density divides the number of listed facilities by the 2020 Census resident population and multiplies by 100,000.
A treatment desert is a county with zero listed facilities. Facilities are placed in counties by their coordinates against Census county boundaries; deserts are only reported when every listed facility in the state has a verified county.
The Medicaid share is the number of listed facilities that report accepting Medicaid divided by all listed facilities; facilities that do not report it count as not confirmed.
Distances are straight-line (great-circle) miles from a county's Census reference point to the nearest geocoded listed facility in any state. They are not driving distances.
These are listed facilities, not capacity or quality: counts describe listings, not beds, wait times, outcomes or proof of access to care.
Known Gaps in This Data
- None reported for this state.
Sources and Reuse
- SAMHSA FindTreatment.gov treatment locator (Substance Abuse and Mental Health Services Administration): Listed treatment facilities, operating status and Medicaid acceptance.
- 2020 Census redistricting data (P.L. 94-171), table P1 (U.S. Census Bureau): State and county resident population (2020).
- 2020 cartographic boundary files, counties (1:500,000) (U.S. Census Bureau): County boundaries for assigning facilities to counties and for the county map.
- 2020 Census Gazetteer files, counties (U.S. Census Bureau): County reference points for nearest-facility distances.
Download this data: County table (CSV) · Full data (JSON)
Licence: this data and its charts are published under the Creative Commons Attribution 4.0 (CC BY 4.0) licence. You may copy, share and adapt them, including commercially. Attribution: credit National Methadone Clinics and link to the source page, https://nationalmethadoneclinics.com/data/mississippi/.